Does this topic even need an introduction?
Speeding up machine learning model training is one thing that all machine learning engineers want. Faster training equals faster experiments equals faster iterations for your product. Also, it means that one model training will require fewer resources. So, straight to the point
Containerization
Yes, this will not speed up your training on its own. But this targets another important aspect — reproducibility. Sometimes virtualenv with fixed library versions is enough, but I encourage you to take one step further and build an all-in-one docker container for your model training.
This ensures that the environment is fully consistent during debugging, profiling, and final training. The last thing you want is to optimize a part of code that is no longer a bottleneck due to python12 speed up, for example. Or even a bug that is not reproducible on different CUDA versions.
As a starting point, you can use pre-built images from NVIDIA. They already have CUDA, PyTorch, and other popular libs installed:

"Hey, it works on my machine. I have no idea why it doesn't on yours."
Get comfortable with PyTorch profiler
Before optimizing anything, you have to understand how long some parts of your code run. Pytorch profiler is almost an all-in-one tool for profiling training. It's able to record:
- CPU operations timings
- CUDA kernels timings
- Memory consumption history
That's all you need. And it's easy to enable!
To record events, all you need is to embed training into a profiler context like this:
import torch.autograd.profiler as profiler

with profiler.profile(
  activities=[ProfilerActivity.CPU, ProfilerActivity.CUDA],
  on_trace_ready=torch.profiler.tensorboard_trace_handler('./logs'),
) as prof:
  train(args)
After that, you can launch the tensorboard and view profiling traces. Do not forget to install torch-tb-profiler.

Profiler has a lot of different options, but the most important are activities and profile_memory. You can experiment with other options, but keep in mind a simple rule: the fewer options you've enabled, the less overhead you have.
So, if you want to profile CUDA kernel execution timings, it is a good idea to turn off CPU profiling and all other features. In this mode, profiling will be as close to the real execution as possible.
To make traces easier to understand, consider adding profiling contexts that describe core parts of your code. If profiling is not enabled, those are no-op.
with profiler.record_function("forward_pass"):
  result = model(**batch)

with profiler.record_function("train_step"):
  step(**result)
This way, the labels that you use will be visible in traces. So, it will be easier to identify code blocks. Or even more granular inside mode's forward:
with profiler.record_function("transformer_layer:self_attention"):
  data = self.self_attention(**data)

...

with profiler.record_function("transformer_layer:encoder_attention"):
  data = self.encoder_attention(**data, **encoder_data)
Understanding PyTorch traces
After you gather traces, open them in the tensorboard. That's what the CPU + CUDA profile looks like:
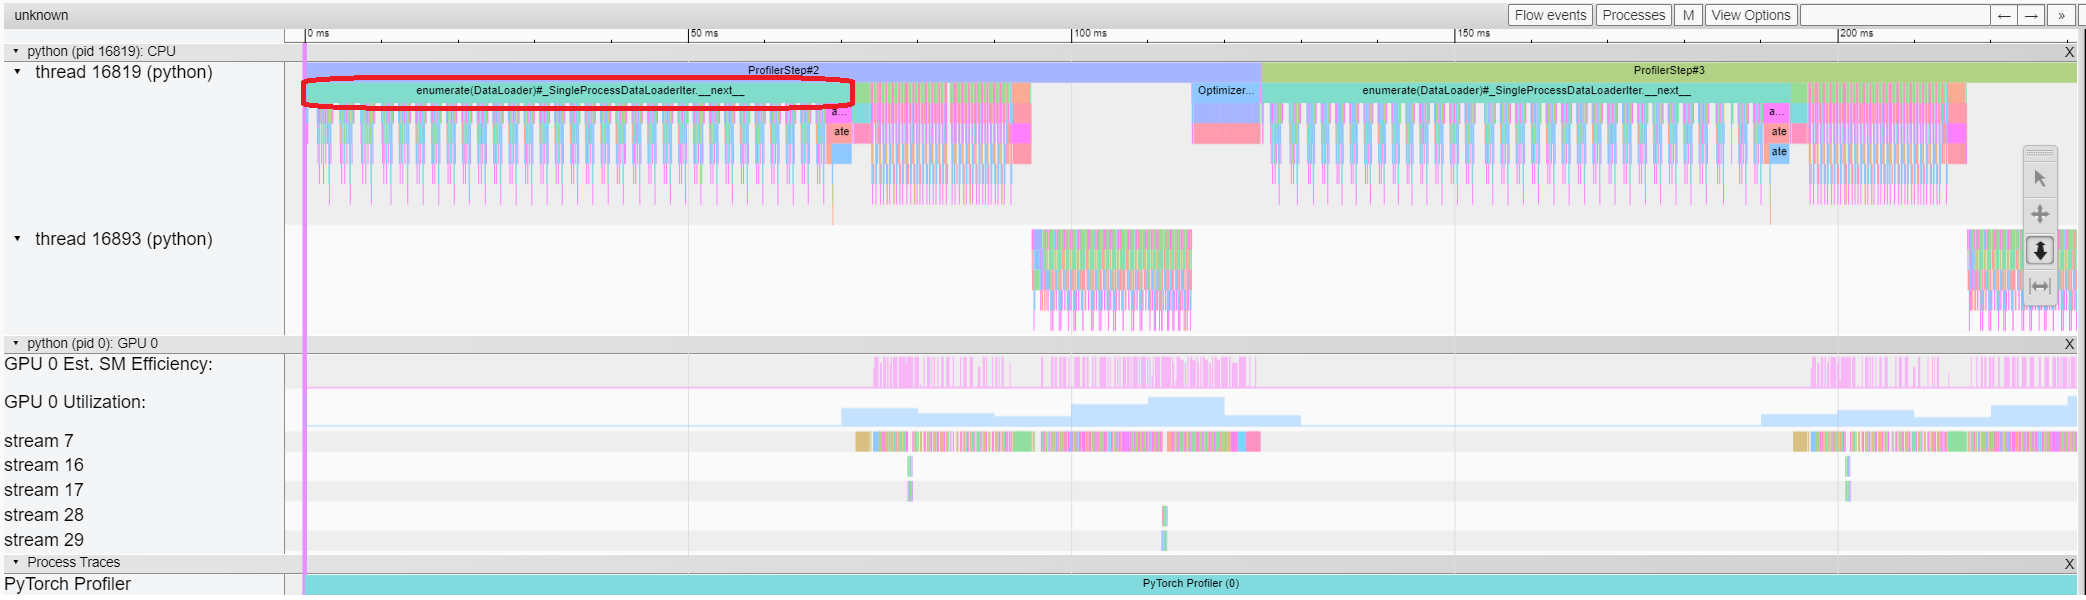
Straight away, find the core parts of any training:
- data loading
- forward pass
- backward pass
Backward pass is handled by PyTorch in a separate thread (thread 16893 on the image above), so it is easy to identify.
Data loading
For data loading, we want near-zero timings.
No compromises.
That's because during data loading GPU does nothing, which under-utilizes available resources. However, data processing can be overlapped with GPU computing as those are independent parts.
You can easily identify areas where GPU is idle — just look at GPU Est. SM Efficiency and GPU Utilization figures in the profiler's trace. Areas with zero activity are our patients. That's where GPU does nothing.
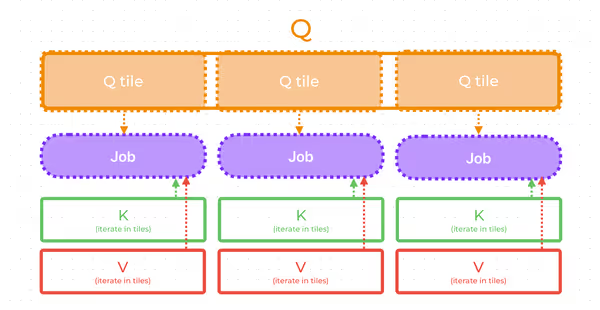
A simple solution for that is:
- process data in the background process (no GIL)
- process data augmentations and transforms in parallel processes
If you use PyTorch DataLoader, then it can be easily achieved by specifying num_workers. It's more complicated if you use IterableDataset, as then data will be duplicated. However, this issue still can be solved by using get_worker_info() — you need to adjust iteration in a way so that each worker receives different, non-intersecting rows.
For more configurable processing, you may consider implementing multi-process transforms yourself with multiprocessing
Making friends with memory allocator
You want to be friends with PyTorch's CUDA caching allocator.
When you allocate tensors with PyTorch on a CUDA device, PyTorch will use a caching allocator. That's because cudaMalloc/cudaFree are expensive operations that we want to avoid, so PyTorch has its allocator that will try to reuse previously allocated through cudaMalloc blocks. That is, if PyTorch's allocator has an appropriate block available, it will give it straight away without calling cudaMalloc. That way, cudaMalloc is called only at the beginning.
However, if you're dealing with data of variable length, different forward passes will require intermediate tensors of different sizes. So, PyTorch's allocator may not have an appropriate block of data available. In this case, the allocator panics and releases allocated previously bocks by calling cudaFree to free up space for new allocations.
After that, the allocator starts building its cache again, doing tons of cudaMalloc, which is an expensive operation. You can spot this problem by looking at the memory profiler section of the tensorboard profiler viewer.
cudaMalloc and cudaFree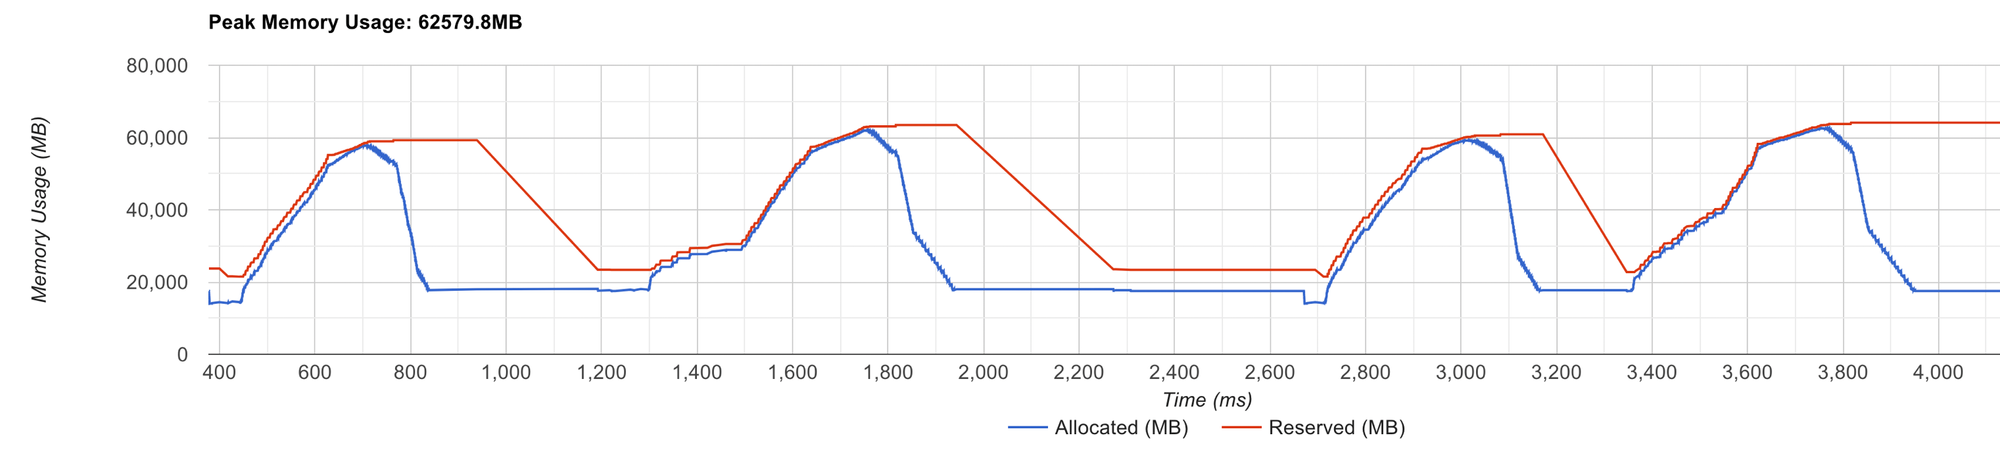
As you see, a red line that corresponds to the allocator's reserved memory constantly changes. That means that PyTorch allocator is not able to efficiently handle allocation requests.
When allocations are handled without the allocator panicking, the red line is completely straight
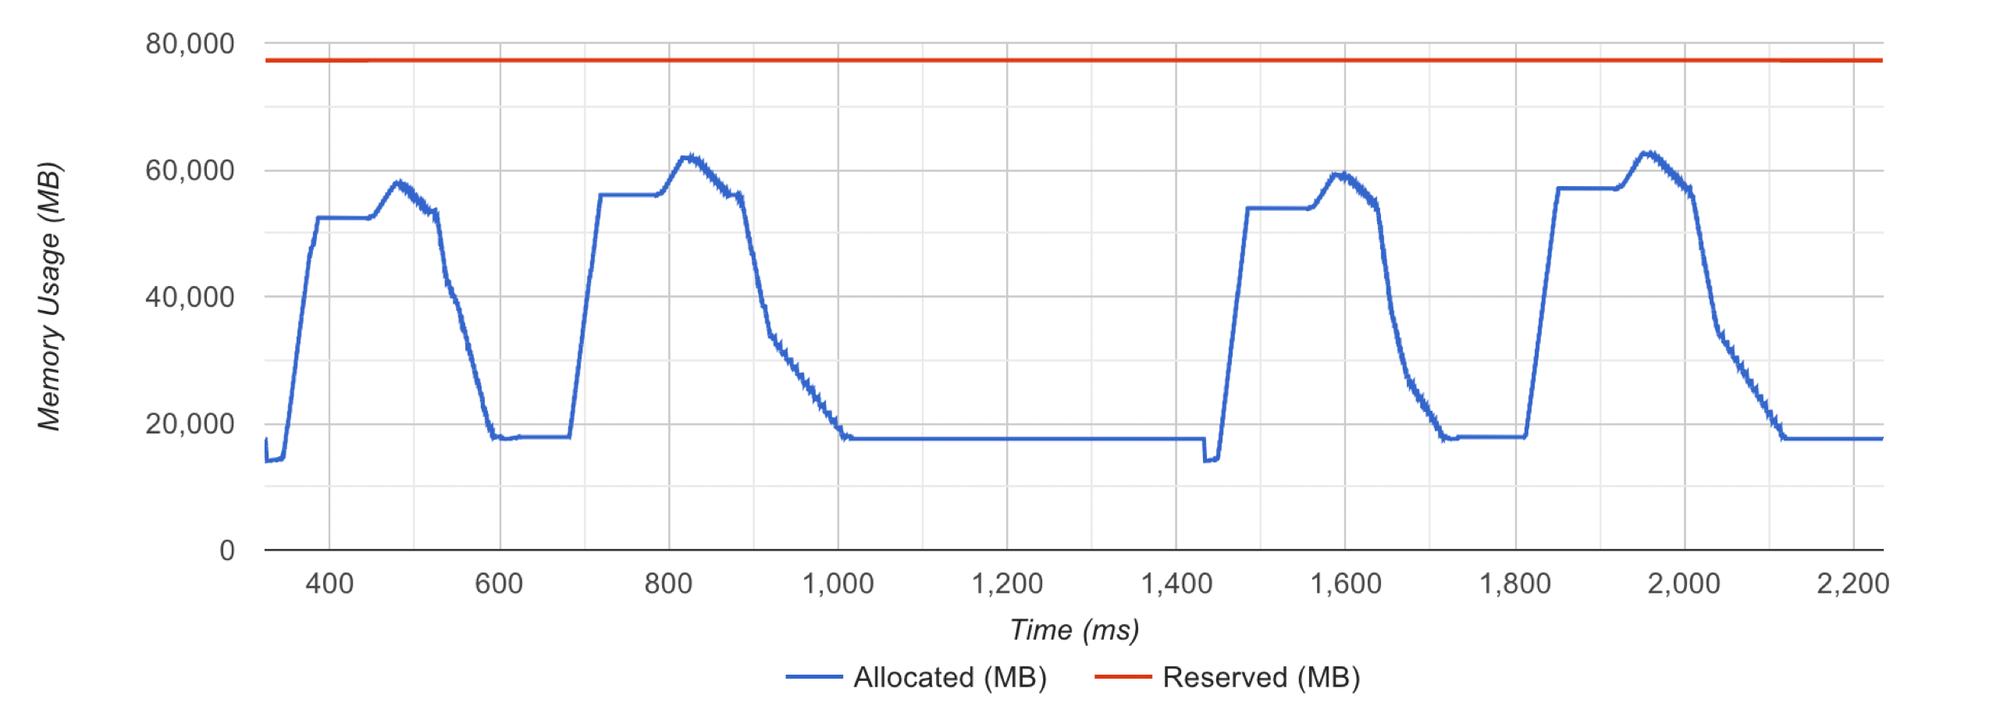
As I said, that is usually due to variable shapes of tensors. How to fix that?
1. Expandable Segments
The first thing that is worth trying is to set PyTorch's relatively new allocator mode:
PYTORCH_CUDA_ALLOC_CONF="expandable_segments:True"If set to True, this setting instructs the allocator to create CUDA allocations that can later be expanded to better handle cases where a job changes allocation sizes frequently, such as having a changing batch size.So, this tells PyTorch allocator to allocate blocks that could be expanded in the future, which is exactly our case. Though, if size variations are too big, it still may fail to solve the issue. In this case, move to the next option.
2. Make allocations variate less
Another possible solution is to make data shapes consistent. That way it will be easier for the allocator to find an appropriate data block to reuse.
To accomplish that, you may pad data to the same sizes. Or you can preheat the allocator by running a model with maximum input sizes.
You can learn more about PyTorch allocator modification in the following article
Tidy up allocations history
We want to use all available GPU memory — that allows us to run big batches and process data faster. However, at some point, you will encounter a CUDA out-of-memory error when increasing batch size. What causes this error?
To debug this, we can view the allocator's memory history. It can be recorded through PyTorch and then visualized at https://pytorch.org/memory_viz
- Start:
torch.cuda.memory._record_memory_history(max_entries=100000) - Save:
torch.cuda.memory._dump_snapshot(file_name) - Stop:
torch.cuda.memory._record_memory_history(enabled=None)
Visualization will draw something like this:
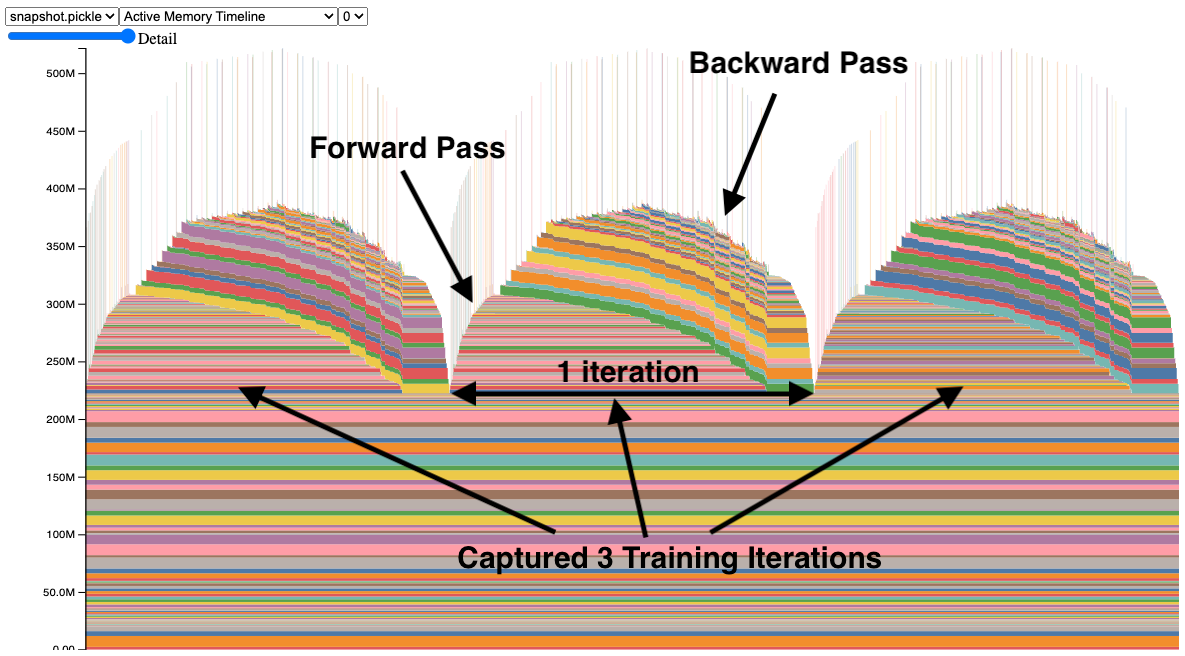
The x-axis represents time, the y-axis represents total used memory, and colourful blocks represent tensors. So, it shows when tensors were allocated and when it was released.
You may notice narrow spikes — those are short-lasting tensors that take up a lot of space. By clicking on a tensor, you can get information on where this tensor was allocated. We want to minimize those spikes as they limit efficient memory usage. Check out what caused this spike and consider other ways of computing what you intended.
Apart from spikes, it's easy to detect memory leaks:
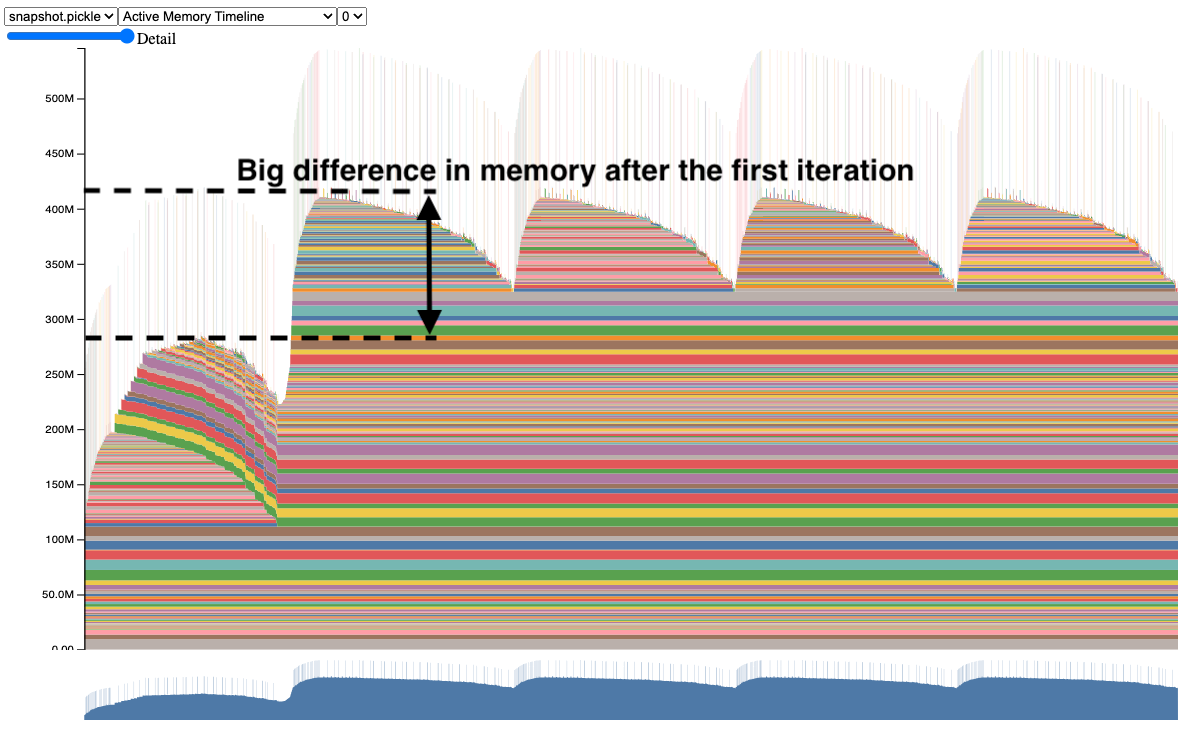
As you see, some data after the first forward is not cleared. By clicking on blocks you can get the idea where these tensors come from. In the image is the case when gradients are not cleared after the training step, so they lay dead during the forward pass, limiting the ability to increase the batch size to fit more data.

Speed up the model and use less memory
What can be better than this? We can achieve so by using the FlashAttention kernel for calculating dot-product attention.
 Dao-AILab
If you haven't heard about it, it is a way of calculating precise dot product attention without constructing the attention matrix explicitly. That optimizes GPU's io operations which improves speed and also dramatically minimizes memory consumption. There's simply no reason not to use it.
Flash attention only works with
fp16 and bf16 precision on compatible hardware. That is NVIDIA Ampere, Hooper, etcOther libraries use flash attention under the hood, so you may consider using other variants that better fit your codebase.
- XFormers
facebookresearch- Transformer Engine
NVIDIA- PyTorch itself!
That is true, new versions of PyTorch may use flash attention when applicable. To activate this mode, you need to execute attention blocks in the context manager that specify which attention strategy to use:
Optimize multi-GPU data redundancy — FSDP
If you use multiple GPUs to run your training, the basic solution is to use the DistributedDataParallel class. This way, several identical processes are spawned, and gradients are aggregated during the backward step.
However, that is sub-optimal!
The problem is as we spawned identical processes, then we have identical models and optimiser states on each GPU, which is redundant. The solution is to shard data across. We can do so using the Fully Sharded Data Parallel PyTorch wrapper.
How does it work?
As I said, when training on several GPUs, each process has exact copies of the same data when training with DDP. We can optimize it, by implementing several enhancements:
Shard optimizer state (ZeRO 1)
When training with DDP, each process holds a complete copy of the optimizer states. With ZeRO1, we shard these optimizer states across all ranks such that each rank holds only a portion of the optimizer states. During the backward pass, each rank only needs to gather the optimizer states relevant to its parameters to make an optimization step. This reduction in redundancy helps conserve memory.
Shard gradients (ZeRO 2)
We shard optimizer states. Now, we will modify the optimizer step to shard gradients too. If one rank has optimizer states for a portion of parameters, then we will:
- aggregate all gradients relevant to the states the rank holds
- calculate optimization step
- send optimization step for a portion of parameters to all other ranks
As you noticed, now each rank does not need to hold a full replica of gradients. We can send gradients to a relevant rank as soon as they are available. So, we can reduce peak memory consumption even further.
Shard model parameters (ZeRO 3)
This is about to be epic.
Why do we need to store a full copy of the model on each rank? Let's shard model parameters between all ranks. Then, we're going to fetch the required parameters just in time during forward and backward.
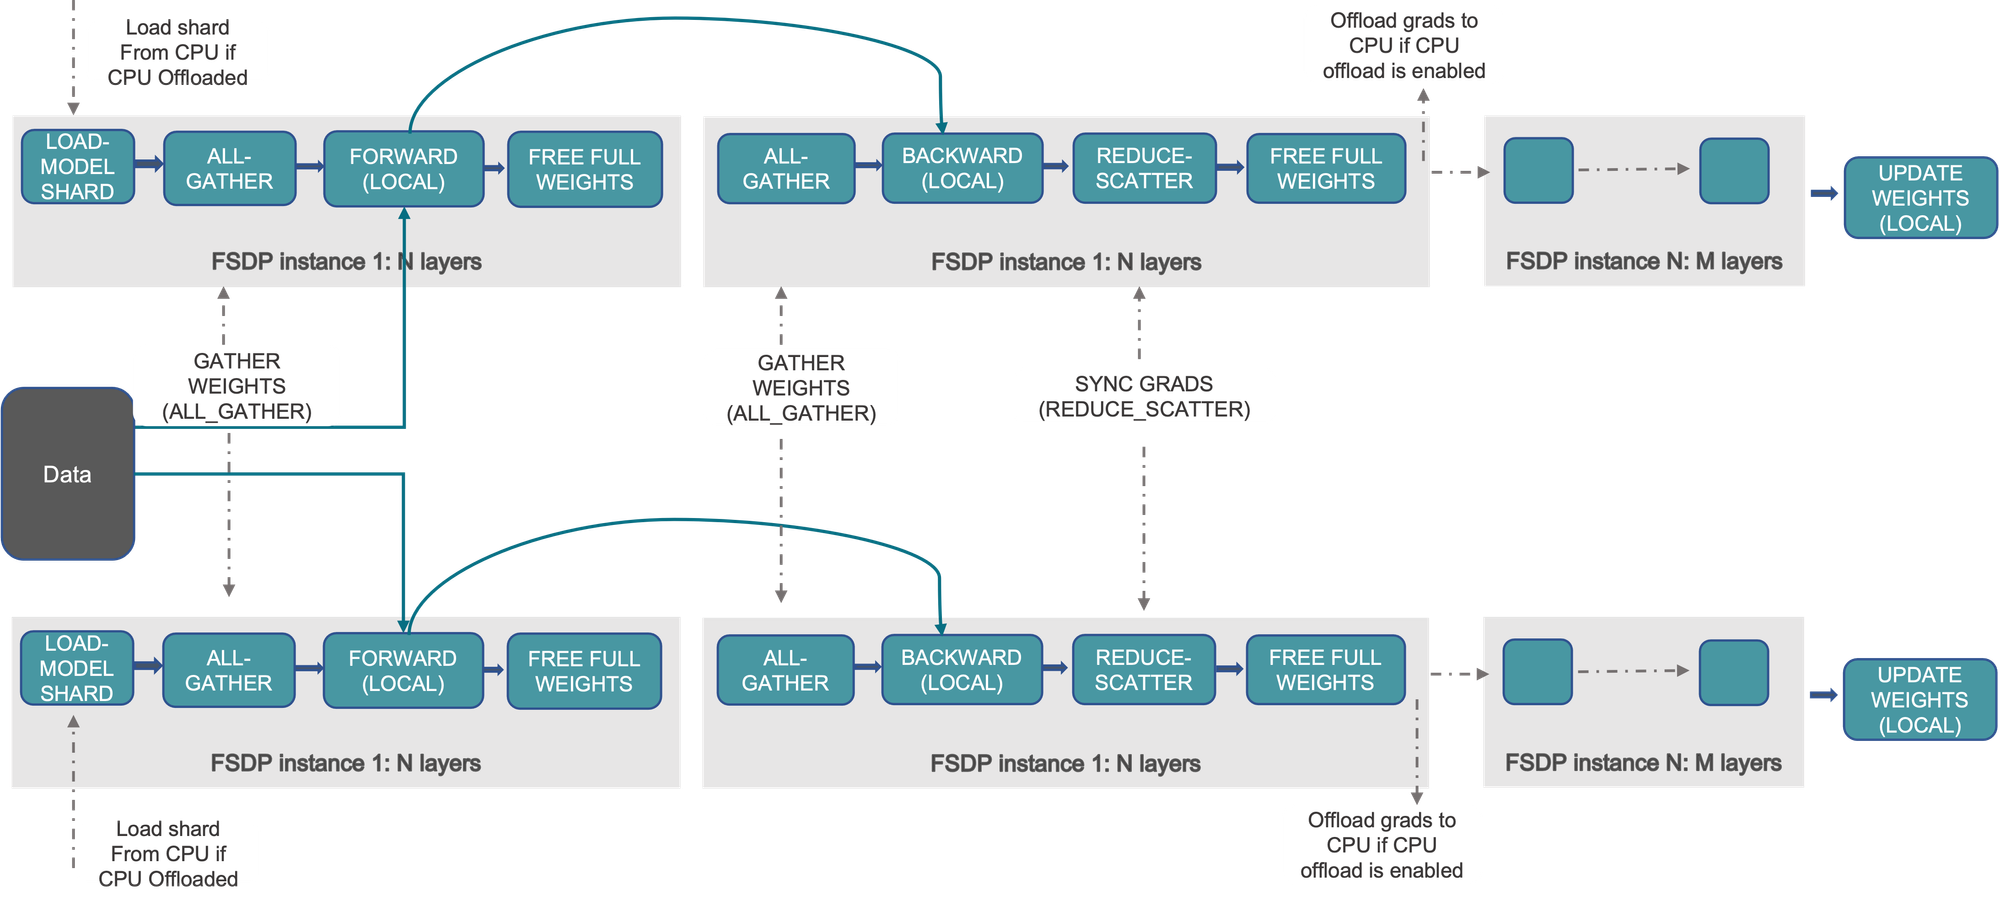
How to use FSDP?
Quite simple actually. All we need is to wrap the model with FSDP:
import torch
import torch.nn as nn
import torch.optim as optim
from torch.distributed.fsdp import FullyShardedDataParallel as FSDP


model = FSDP(model)

# it's critical to get parameters from the wrapped model
# as only a portion of them returned (sharded part)
optimizer = optim.Adam(model.parameters())

# consuct training as usual
train(model, optimizer)
You can also specify the sharding strategy of FSDP. For example, we can select the SHARD_GRAD_OP strategy to achieve behaviour similar to that of ZeRO2. You can learn about other strategies here:
Also, you can wrap with FSDP submodules. In the example above, only one FSDP module is used, which will reduce computation efficiency and memory efficiency. The way it works is that, suppose your model contains 100 Linear layers. If you do FSDP(model), there will only be one FSDP unit which wraps the entire model. In that case, the allgather would collect the full parameters for all 100 linear layers, and hence won’t save CUDA memory for parameter sharding.
You can wrap submodules explicitly or define an auto-wrap policy. To learn more about FSDP, read the PyTorch guide:

Magic speedup with torch.compile
That is, torch compile can speed up your code by several percent by just enabling it.
Torch traces your execution graph and tries to compile it into an efficient format so that the model can be executed almost without Python invocation.
Basic usage is to wrap the model with compile:
import torch

model = torch.compile(model)
This will execute almost instantly. The actual tracing will happen only during the first forward.
It also has a lot of options that are worth to try:
Stay tuned
Learn more about torch compile here:
Conclusion
This post is in no way complete with explanations. Rather, that is a list of speed-ups that are worth trying straight away. Hope that it was helpful. Feel free to leave a comment!
Consider subscribing